Characterization of Inner Cavity Lining of Proteins
Submitting a PDB File
The user can submit a protein structure only in the form of a PDB file. CICLOP does not support any other file format.
This can be done directly from the home page.
Providing an email address has been made mandatory in case the user wishes to use the webserver. The results of the job submitted are reverted back at the provided email.
Please be informed that CICLOP does NOT in any way store the provided email address.
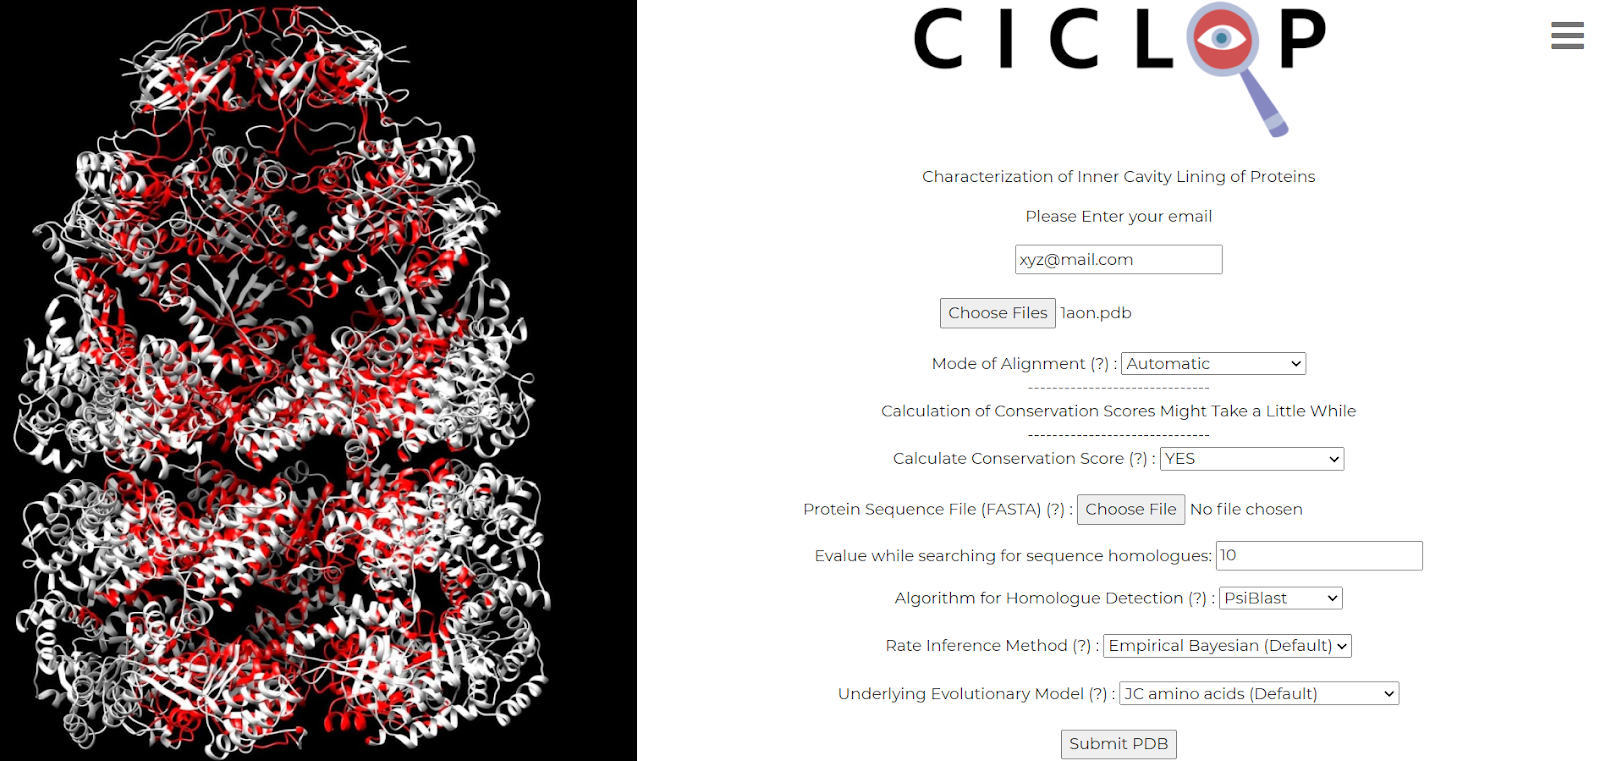
For demonstrating the various parameters that CICLOP has to offer, we shall be using Crystal Structure of the Asymmetric Chaperonin Complex GROEL/GROES/(ADP)7, (PDBID 1AON).
CICLOP offers two modes of alignment, in the Automatic mode, the input structure is rotated such that the pore aligns along the Z axis, while in Manual mode, CICLOP assumes that the input structure is aligned along the Z-axis.
The user may also choose to compute the conservation profile of the cavity by choosing “YES” from the drop down. Subsequently, the user may be required to upload a FASTA file containing the sequence of the protein. FASTA files are to be submitted in the following format:
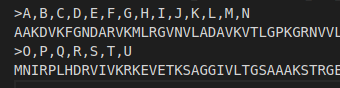
As seen above, the provided file can contain as many sequences but bear in mind that each sequence must also be accompanied by a header.
The header for a sequence is used to specify the chains in the uploaded PDB file corresponding to the accompanying sequence. In case of multiple chains, simply add all the chain IDs separated by a comma(","). Please not the comma separated values are NOT accompanied by a space in between. Also ensure that any other spaces are also ommited from the header. Not doing so might lead to unconventional results. As evident from the above file, the first sequence of amino acids corresponds to chains A-N while the second sequence of amino acids corresponds to chains O-U in the accompanying protein structure.
The user can calculate conservation scores even if he/she does not provide any FASTA file. In such a case, the protein structure is examined for all the unique sequences existing in the protein. If the complete protein structure is known, the results will be as good as if a FASTA file was also provided. But in case of missing structural segments, the results can be erroneous. In such cases, to obtain correct results, the user MUST also provide a FASTA file.
The input sequence is then queried against the non-redundant database (nr database) using PSI-BLAST or swiss-prot using jackhmmer. (Users are advised to use jackhmmer in case they wish to detect distant homologues). The choice of method for detection of homologue has to be chosen from the drop down.
Subsequently, an E-value cut off needs to be set and a method for calculation of Rate inference and computation of evolutionary scores needs to be chosen.
Once a job is submitted, the results are reverted back to the user on the email address provided as a zip file. The results are only stored for minimum for a week and can be deleted anytime after the passage of the due week.
Files that make up the Result
- Input files (2 files) : The input PDB file as well as the input FASTA file submitted
- Residue.dat (1 file): This file enlists all the residues that were found to line the cavity. It displays the residue number as well as chain ID separated by a dot.
- Files for visualization (5 files) :
- inner_surface_marked.pdb - This file is the B factor loaded output generated. All atoms detected to be on the inner surface have a B factor value of 9999 and therefore can be easily distinguished from the bulk atoms that make up the protein. For details about visualization please refer here
NOTE:A visualization of the same can be found towards theh left of your screen - cavity.pqr - This can be used to visualize the volume of the cavity detected by the cavity.
- inner_ATOMS_conservation scores.pdb: This B factor loaded pdb can be used to visualize the evolutionary conservation of atoms detected to line the cavity.
- ALL_ATOMS_conservation_scores.pdb : Another B factor loaded pdb file that can be used to visualize the evolutionary conservation of the entire protein.
- inner_RESIDUES_conservation scores.pdb: This B factor loaded pdb can be used to visualize the evolutionary conservation of residues detected to line the cavity.
- inner_surface_marked.pdb - This file is the B factor loaded output generated. All atoms detected to be on the inner surface have a B factor value of 9999 and therefore can be easily distinguished from the bulk atoms that make up the protein. For details about visualization please refer here
-
Cavity characterizing profiles (5 files)
-
radius_profile : This is a plot for diameter (in Angstroms) of cavity vs length of the pore.

-
volume_profile : This is a plot for the volume (in cubic Angstroms) vs length of the pore

-
conservation_profile : The residue-wise conservation frequency as a function of length of pore along Z-axis

-
charge_distribution_profile: The number of positive as well as negatively charged residues along the length of pore

-
hydrophobicity profile: The hydrophobicity scores of all the residues according to Kyte-Doolittle scale along the length of the pore

-
radius_profile : This is a plot for diameter (in Angstroms) of cavity vs length of the pore.
-
Results_summary.txt : The summary file contains the following information:
- The PDB file name submitted
- Number of atoms detected to be lying on the inner surface
- The number of residues found on the inner surface. This is further divided into the following 3 categories:
- Based on a single atom: This is the count of the number of residues given the assumption that if even a single atom was detected on the inner surface, CICLOP will treat the whole residue to lie on the inner cavity lining
- More than 50% but not completely inside
- Residues with 100% of their atoms lying on the inner surface
- Total Pore Volume (in cubic angstroms)
- Total number of charged amino acid residues. This again is further divided into the number of positively charged as well as the number of negatively charged residues
- The number of Hydrophobic as well as Hydrophilic residues in the cavity (according to the Kyte-Doolittle scale). Judging by the numbers, CICLOP also makes an overall comment on the hydrophobic/hydrophilic nature of the detected cavity.
- Secondary Structure Information: DSSP is used to find out the secondary structures taken up by the different residues in the submitted protein structure. This information is then mapped to the inner residues detected by CICLOP and the number of inner lying residues is written in the summary file for each category of secondary structure (alpha helix, 3-10 helix, pi helix, isolated beta-bridge, extended strands, hydrogen-bonded turns, bends, loops/unstructured residues)
How to Visualize the Inner Surface
-- Open the PDB with "-inner_residues.pdb" added after the original filename in any molecular visualizer of your choice
-- The information for an atom being on the inner surface is stored as the b-factor values of the atoms in this PDB. An atom with a b-factor of 9999 is determined to be on the inner surface of the structure while those with a value of 0 are not
-- For viewing the inner surface in an atomistic fashion, render the PDB as atoms and color them according to their b-factor
(It's as simple as that)
-- For viewing the inner surface as ribbons (Just like the image to your left) or in any other format, render the image in the required format and color all the residues with a single color. Open the file having "-residue_list.dat" after the PDB name. This file contains all the residues on the inner surface in the format "Residue_Number.Chain_ID (residue number dor chain ID)" (Beware of the extra "," at the end of the file). Select all the residues in this file and color them with a color other than the one used a little while ago in this section. And Voilla, There you have it!!